
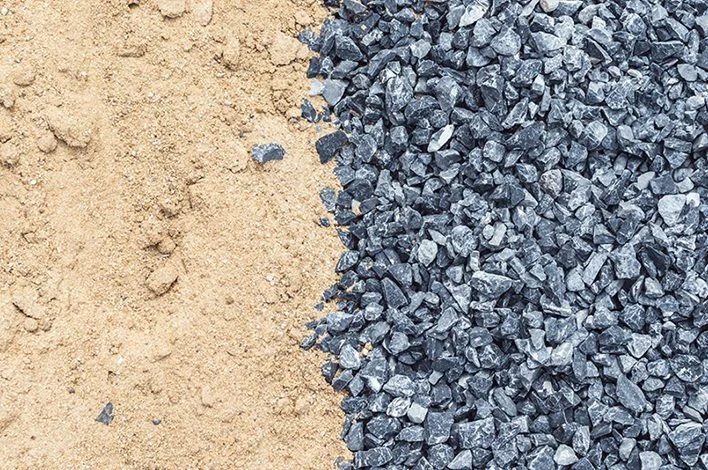
Combined aggregate gradation is the particle size distribution of all the aggregate in a mix — fine and coarse, analyzed together as one blend rather than as two separately compliant materials. It matters because concrete is mostly aggregate, and the gaps between those particles have to be filled with paste. A well-graded blend has fewer gaps, needs less paste to fill them, and therefore needs less water and less cement to reach a given workability. A gap-graded blend needs more of both, and you pay for that in shrinkage, in finishing effort and in cracking.
Here is the part that gets missed on Alberta job sites: a sand and a stone can each pass their own specification and still combine into a poor blend. CSA A23.1 grades them separately. Nothing in that pair of tables guarantees the two work together.
This article covers how the combined blend is evaluated, what the three common analysis methods actually tell you, and what a badly proportioned blend looks like when it arrives at your forms.
How aggregate is specified in Canada, and where the gap is
In Canada, aggregate grading is governed by CSA A23.1, with test methods in CSA A23.2. Three references matter:
| Reference | What it covers |
|---|---|
| CSA A23.1 Table 10 | Grading limits for fine aggregate (sand) |
| CSA A23.1 Table 11 | Grading limits for coarse aggregate, by nominal maximum size |
| CSA A23.2-2A | Sieve analysis of fine and coarse aggregate, including fineness modulus of fine aggregate |
CSA A23.1 also allows blending on the fine side: under Clause 4.2.3.3.2.1, individual sands combined to meet Table 10 do not each have to meet Table 10 on their own, provided the final blend does. That clause is a quiet acknowledgement that what matters is the blend, not the component.
What the tables do not do is tell you how the approved sand and the approved stone stack up once they are in the same drum. That analysis — the combined gradation — is voluntary in most Canadian specifications. It is also where most of the available performance is sitting.
The American equivalents you will see referenced on mix submittals are ASTM C33 for concrete aggregates, with AASHTO M6 and M80 as the transportation-sector counterparts. They have the same structure and the same blind spot.
The three methods for reading a combined blend
There are three charts a mix designer will put in front of you. None of them is a code requirement in Alberta. All three are worth being able to read.
The 0.45 power curve
The oldest of the three, dating to 1907. Percent passing is plotted against sieve size raised to the 0.45 power, and a straight line from the origin to the nominal maximum size represents maximum theoretical aggregate density. The closer the actual gradation plots to that line, the more optimized the packing.
It is a good sanity check and a poor specification. Real mixes deliberately sit off the line — pumped concrete in particular needs more fines than maximum-density theory wants.
The individual percent retained chart, or “8-18”
Developed by Shilstone in 1990. You plot the percentage of the combined blend retained on each individual sieve and aim to keep every sieve between 8% and 18% retained. Sieves that fall below the band are the gaps; sieves that spike above it are the surpluses.
This is the most useful of the three for a site conversation, because a single glance shows you which particle size is missing. Worth knowing, though: FHWA’s own guidance notes that “previous experience has suggested the lower and upper limits of 8 and 18 percent, respectively, but there is limited research to justify these limits.” Treat the band as a diagnostic, not a pass/fail gate.
The coarseness factor chart
Also Shilstone. Two numbers are calculated and plotted against each other:
- Coarseness Factor (CF) = (Q ÷ R) × 100, where Q is the cumulative percent retained on the 3/8 in. sieve and R is the cumulative percent retained on the No. 8 sieve.
- Workability Factor (WF) = W + (2.5 × (C − 564) ÷ 94), where W is the percent passing the No. 8 sieve and C is the cementitious content in lb/yd³.
A coarseness factor of 100 describes a blend with no intermediate aggregate — the classic gap-graded mix. A value of 0 describes a mix with no coarse aggregate at all. The chart is divided into zones, with Zone II generally reported as the desirable target for paving mixes using 3/4 in. to 2 in. nominal maximum sizes.
Note the WF formula takes cementitious content as an input. That is the honest part of the method: workability is a property of the paste-and-aggregate system, not of the rock alone.
The tarantula curve
A fourth method you will increasingly see, developed by Cook and Ley in 2013 and refined against more than 500 mixtures. It sets individual percent-retained limits with an emphasis on segregation resistance and workability, broadening the bounds relative to the 8-18 band on most fractions while tightening the No. 8 and No. 16 sieves. Its contribution is the focus on sand fractions, which is precisely where Alberta blends tend to go wrong.
What a badly graded blend does on an Alberta pour
The theory is tidy. Here is what it looks like at the forms.
Too little intermediate aggregate (the gap-graded mix). The blend has stone and it has sand, but not enough of the 3/8 in. to No. 8 material in between. The mix looks harsh in the chute, wants water, and then bleeds. Finishers describe it as “boney.” It will not hold a clean vertical edge on a slipformed curb, and it needs more vibration to consolidate — FHWA notes the reverse case, that well-graded systems mean “less effort is required to consolidate and finish the slab” and support “a nearly vertical edge.”
Too much fine sand. Water demand climbs, because fine particles have enormous surface area to wet. More water at a fixed cementitious content means a higher water-to-cementing-materials ratio, which means lower strength and higher permeability — the exact opposite of what a C-1 or C-2 exposure class is asking for on Alberta exterior flatwork. Excess fines also complicate air entrainment, and entrained air is the whole freeze-thaw defence in this climate.
Too much paste compensating for a poor blend. This is the expensive failure, because it hides. The mix places beautifully and cracks later. Paste shrinks; aggregate does not. Every extra litre of paste per cubic metre is extra shrinkage looking for a joint — and if the joints are not there, it finds its own.
The scale of the available saving is real. One University of Toronto study cited by the National Precast Concrete Association reported paste reductions of up to 16% in 7,250 psi mixes through combined gradation optimization, with overall cost savings per cubic yard even though the aggregate itself cost more.
| Symptom at the forms | Likely gradation cause | What it costs you |
|---|---|---|
| Harsh, rocky mix; crew calling for water | Deficient intermediate sizes (3/8 in. to No. 8) | Added water on site, lower strength, surface defects |
| High water demand at target slump | Excess fine sand below the No. 30 | Higher w/cm, more shrinkage, weaker surface |
| Bleeding and delayed finishing window | Poorly distributed sand fractions | Blistering, crusting, scaling risk |
| Excessive vibration needed | Gap-graded blend | Segregation, honeycombing, inconsistent cover |
| Edge slump on curb or slipform work | Low coarseness factor, not enough stone | Rework |
Diagnostic table — confirm the cause with an actual sieve analysis before changing a mix.
What this means when you order concrete in Calgary
Three practical takeaways.
First, gradation and slump are different questions. A mix can hit its target slump and still be badly graded — it just needed more water or more admixture to get there. If the crew is unhappy with a mix that met its slump on the slump test, gradation is the next thing to look at, not the last.
Second, gradation and strength class are also different questions. Specifying a higher MPa does not fix a boney mix. It usually makes it worse, because the extra cementitious content changes the workability factor without touching the aggregate distribution.
Third, volumetric production changes the conversation. On a volumetric mixer, the sand and stone are metered on site from separate bins, so the combined blend is something that can be discussed and adjusted for the placement in front of you — a pump line, a tight slipform, a hand-finished flatwork pour — rather than fixed hours earlier at a plant. If gradation matters on your pour, say so when you order.
If you are specifying for a job where finishability, pumpability or shrinkage is the controlling risk, ask for the combined gradation with the mix submittal, not just the two individual sieve analyses. Our team builds custom mixes around exactly these constraints, and the conversation is far cheaper before the truck is loaded.
Frequently asked questions
What is combined aggregate gradation? It is the particle size distribution of the fine and coarse aggregate in a concrete mix analyzed together as a single blend, rather than as two materials checked separately against their own grading limits.
Does CSA A23.1 require combined gradation analysis? No. CSA A23.1 sets grading limits for fine aggregate in Table 10 and coarse aggregate in Table 11, tested per CSA A23.2-2A. Combined gradation analysis is a voluntary optimization tool, not a compliance requirement, though it may be written into a project specification.
What is the 8-18 rule? It is a chart method in which the percentage of the combined blend retained on each individual sieve is kept between roughly 8% and 18%. It is a useful diagnostic for spotting missing particle sizes. FHWA notes there is limited research behind the specific 8 and 18 limits.
Will optimizing gradation reduce cracking? It can reduce shrinkage cracking, because a better-packed aggregate skeleton needs less paste and paste is what shrinks. It will not eliminate cracking, and it does not replace correct joint spacing, curing or subgrade preparation.
Does better gradation let me use less cement? Often, yes, at the same workability — that is the main economic argument for optimization. One study cited by NPCA reported paste reductions of up to 16% in high-strength mixes. The saving depends entirely on the aggregates available locally.
Is this relevant for a residential driveway, or only for paving and structural work? It is relevant to anything you have to finish. Flatwork is where a poorly graded mix is most visible, because the finisher is working the surface directly and bleeding, crusting and edge slump all show up in the final product.
Sources
- National Precast Concrete Association, Combined Aggregate Gradation, Precast Today Q1 2023: https://precast.org/precasttoday/q1-2023/combined-aggregate-gradation/
- Federal Highway Administration, Tech Brief FHWA-HIF-15-019, Blended Aggregates for Concrete Mixture Optimization: https://www.fhwa.dot.gov/pavement/concrete/pubs/hif15019.pdf
- Federal Highway Administration, FHWA-HIF-18-012, Specifying, Designing, and Proportioning Paving Concrete: https://www.fhwa.dot.gov/pavement/pubs/hif18012.pdf